The IBD 50 is the Investor’s Business Daily’s “flagship screen of leading growth stocks that gives you 50 companies showing strong relative price strength and top-notch fundamentals”, according to the publication’s website. The index uses the CAN-SLIM methodology, which looks for companies with earnings growth, some sort of product/service catalyst, industry leadership and conviction. CAN-SLIM tends to produce a portfolio filled with higher growth, higher risk names.
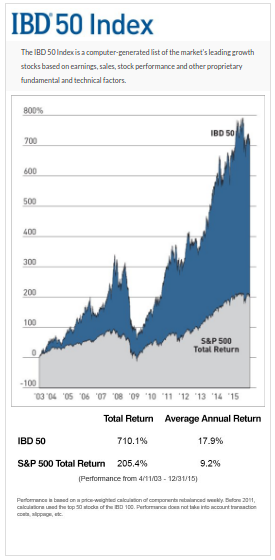
It also boasts quite a track record of beating the S&P 500 over time. Consider first this chart from the Investor’s Business Daily site that details the index’s performance from 2003 through the end of 2015.

The difference in average annual returns between the IBD 50 and the S&P 500 is stunning. During the 12+ year period between 2003 and 2015, the IBD 50 outperformed the broader market by almost 9% per year (caveat: the small print says that prior to 2011, calculations used the “top 50 stocks of the IBD 100” so there may be some posturing there).
So, investor interest was high when it was announced that Investor’s Business Daily decided to work with Innovator Capital Management to bring the Innovator IBD 50 ETF (FFTY) to market. It’s the first time that the IBD 50 would be an investable product.
But early investors into the fund didn’t get the kind of performance they were hoping for. From the fund’s launch in April 2015 through the end of 2016, the IBD 50 ETF actually lost 3.4% compared to an 11.1% gain for the S&P 500. During that time, the S&P 500 Value ETF (SPYV) outperformed the S&P 500 Growth ETF (SPYG) by roughly 450 basis points. The fund’s fast growth style was out of favor, but its severe underperformance was especially disappointing by almost any standard.
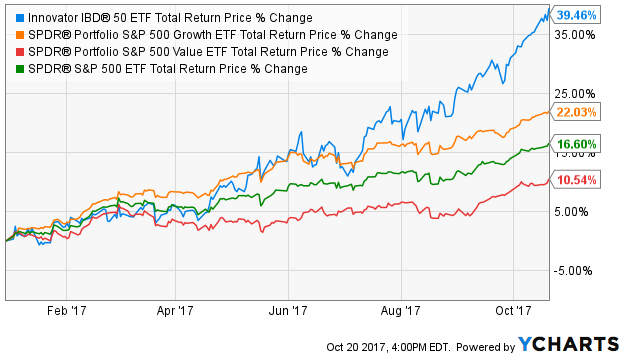
2017, however, has been a different story. Fueled by a post-election rally, growth is back in style and the IBD 50 ETF has capitalized. Year-to-date, the fund is up nearly 40%, more than double the return of the S&P 500.

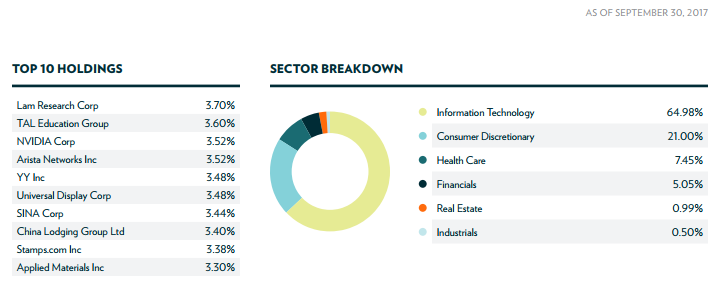
So, what can we attribute the fund’s comeback story to? Credit individual stock selection and appropriate sector weightings. Momentum has easily been the top performing smart beta factor this year (the iShares Edge MSCI USA Momentum Factor ETF (MTUM) is up more than 32%), and the CAN-SLIM methodology makes the IBD 50 ETF a strong momentum play. The first half of the year was powered by strong gains in Nvidia (NVDA), Cognex (CGNX) and Dave & Buster’s (PLAY). The second half benefited from a major overweight in tech stocks (the fund currently has nearly ⅔ of assets dedicated to the space) and enjoyed big gains from companies such as Lam Research (LRCX), Arista Networks (ANET) and Stamps.com (STMP).

The fund has also benefited from avoiding underperforming sectors. Three of the year’s biggest underperforming sectors - real estate, energy and consumer staples - have been virtually non-existent in the portfolio. The 20% allocation to China, specifically in names such as Alibaba (BABA) and China Lodging (HTHT) which have both doubled in 2017, has also fueled this year’s gains.
Has the IBD 50 ETF regained its former glory? As long as the momentum factor is a market leader, I think the answer is yes. The fund’s methodology seems to work well when the market’s winds are at its back. Momentum was the poorest performer of the smart beta factors in 2016, which is probably a significant reason the fund underperformed. There are both believers and detractors in the CAN-SLIM methodology, but it’s shown it can work in the right situations. Its expense ratio of 0.80% is actually pretty reasonable for an actively managed fund, especially one that rebalances its holdings as frequently as this one does. As long as momentum remains in favor, this fund should continue to do well, but watch out for when the market’s winds change.
If you enjoyed reading this article, please be sure to share it below and subscribe to the site so that you don't miss any updates or new stuff! As always, thank you for taking the time to read!

