

Periodically, I answer user questions that come up in comment threads and messages in a little more depth. I haven't done one of these in a little while, but I've gotten some great questions lately that are worthy of the in-depth treatment. As always, if there's a question on your mind, feel free to comment on one of my articles, comment down below or shoot me a message. I may end up using your question in a future Q&A!

Today's question (lightly edited for clarity)...
Question: In my experience, Fidelity has outstanding customer service too. Could you review their smart beta offerings one day? They have several new ETFs in this category. Thank you for great articles!
Answer: This question came up in the comment thread of the article I wrote recently about Fidelity's new 0% expense ratio mutual funds. Fidelity, surprisingly, was late to enter the ETF game. The Fidelity Nasdaq Composite Index ETF (ONEQ) has been around since 2003, but it wasn't until they launched their lineup of sector ETFs in 2013 that Fidelity truly entered the ETF arena. Its roster now consists of 25 ETFs, including 10 that fall into the "smart beta" category.
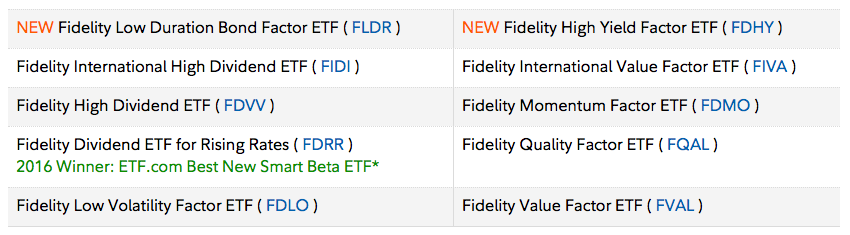 Fidelity's sector ETFs are some of the cheapest in their respective spaces charging just 0.08%. Their smart beta ETFs? Not so much. The Momentum, Quality, Value and Low Volatility factor ETFs all charge 0.29%. This is significantly higher than Vanguard's recently launched lineup of actively managed factor ETFs, which charge 0.13%, and the iShares Edge group of factor ETFs, which charge 0.15%. The fee structure puts Fidelity a bit behind the 8-ball, but it's also important to consider how the funds' underlying indices are constructed and if they make sense.
Let's break down each of them briefly to examine how they're put together and if they're worthy of consideration in your portfolio.
Fidelity High Dividend ETF (FDVV)
FDVV is more or less your standard dividend ETF that targets high yielders. It starts with roughly the largest 1000 companies and then layers on the following criteria.
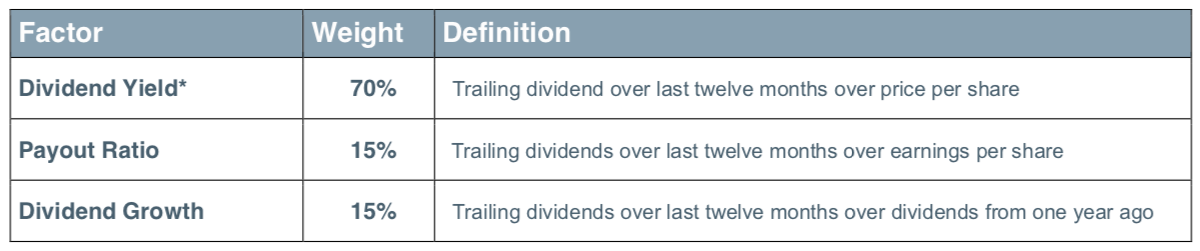 The screens for payout ratio and dividend growth over the past year are simple ways to put a bit of a quality twist on the portfolio, but this ETF is mostly just targeting high yields. The way the portfolio is built works fine, but in a universe where you can have a similar fund, such as the SPDR Portfolio S&P 500 High Dividend ETF (SPYD) for just 0.07%, it makes it more difficult to choose FDVV. The fund's 3.9% yield is enticing.
Highly correlated ETF: Vanguard High Dividend Yield ETF (VYM)
Fidelity Dividend ETF for Rising Rates (FDRR)
I've disliked this fund since it launched because calling it a rising rates ETF is a bit of a misnomer. Like FDVV, FDRR is a straight dividend ETF more than anything.
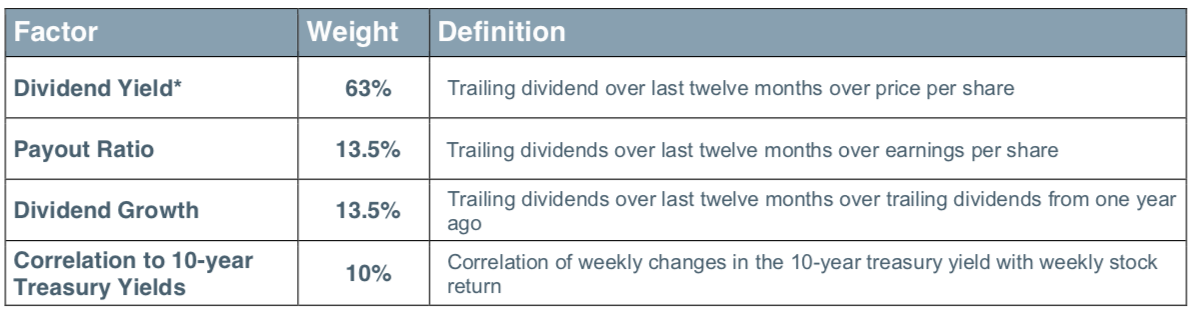 Just 10% of a stock's weighting in the portfolio is based on its correlation to 10-year Treasury yields. The financials sector, which is generally considered the most positively correlated to Treasury yields, has a modest 14% allocation in FDRR, compared to a 31% allocation in the ProShares Equities for Rising Rates ETF (EQRR). FDRR has 26% of assets in tech, where EQRR doesn't even rate it as one of the top 5 most correlated sectors. If you're looking for true rising rate protection, there are better ETFs than this one.
Highly correlated ETF: WisdomTree Large Cap Dividend ETF (DLN)
Fidelity Low Volatility Factor ETF (FDLO)
FDLO looks at the commonly-used factors of standard deviation and beta to judge volatility, but throwing the standard deviation of EPS into the equation is an interesting wrinkle.
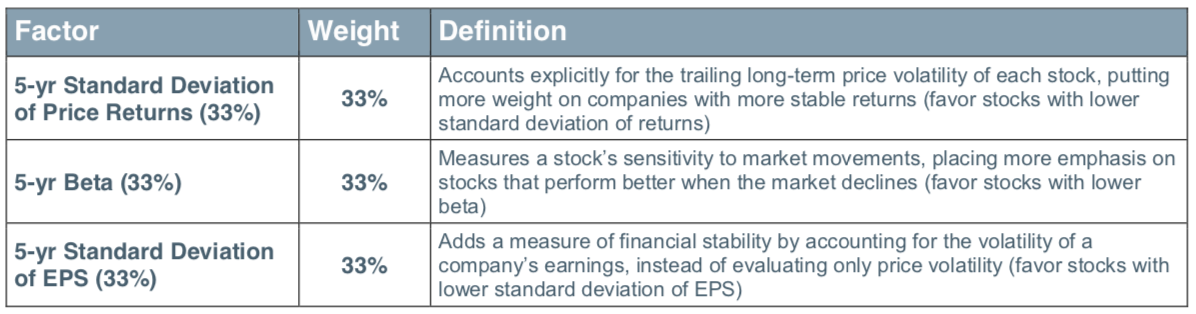 The higher expense ratio isn't quite as significant a factor as was the case with FDVV. The Invesco S&P 500 Low Volatility ETF (SPLV) has a similar expense ratio, but the iShares Edge MSCI USA Minimum Volatility ETF (USMV) comes in at 0.12% cheaper. Overall, I like the methodology used by the fund.
Highly correlated ETF: iShares Edge MSCI USA Minimum Volatility ETF (USMV)
Fidelity Momentum Factor ETF (FDMO)
There are a number of ways to define momentum - some use short-term price movements while others look longer-term. FDMO seems to land somewhere in the middle using 12 months of data to make its judgements.
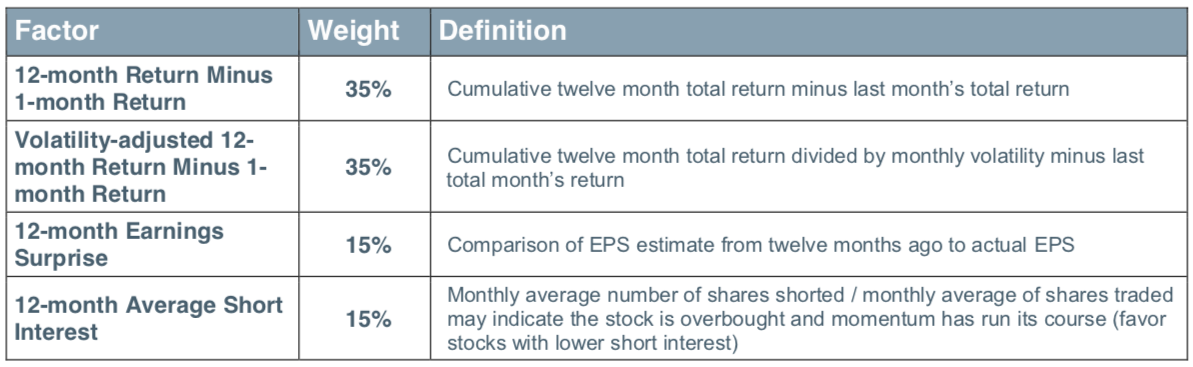 Like FDLO, FDMO uses factors that aren't commonly implemented elsewhere. Earnings and short interest momentum make up nearly 1/3 of the fund's criteria. The natural comparison here is the iShares Edge MSCI USA Momentum Factor ETF (MTUM), which looks at risk-adjusted returns over the risk-free rate for the past three years. The big difference I see is that FDLO measures a stock's momentum by comparing it to its year-ago self, where MTUM measures a stock's momentum against a risk-free rate benchmark.
Highly correlated ETF: iShares Edge MSCI USA Momentum Factor ETF (MTUM)
Fidelity Quality Factor ETF (FQAL)
Quality seems to be the one factor within the industry that is capturing more attention lately. With momentum strategies losing some of their steam over the past few months, quality is the factor that's often viewed as the best combination of downside protection, lower volatility and higher dividend income heading into an uncertain economic environment.
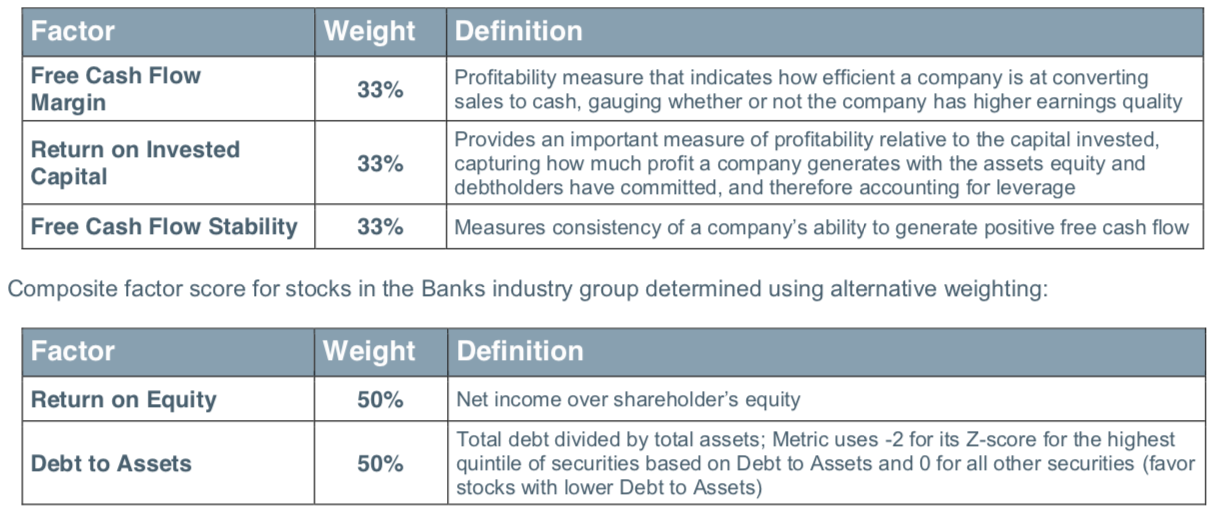 FQAL uses one of my favorite measures, free cash flow, as its primary qualifier. High levels of free cash means a company has a lot of liquidity and flexibility in order to reinvest in its business, increase dividends or take advantage of growth opportunities. Return on invested capital is also a good measure, since, as it says in the definition, it takes into account debt levels so to minimize exposure to highly leveraged companies.
Highly correlated ETF: Invesco S&P 500 Quality ETF (SPHQ)
Fidelity Value Factor ETF (FVAL)
If you break it down, FVAL has a strong quality tilt to it as well. Enterprise value and book value and pretty common in determining attractiveness, but the other factors used are a nice complement.
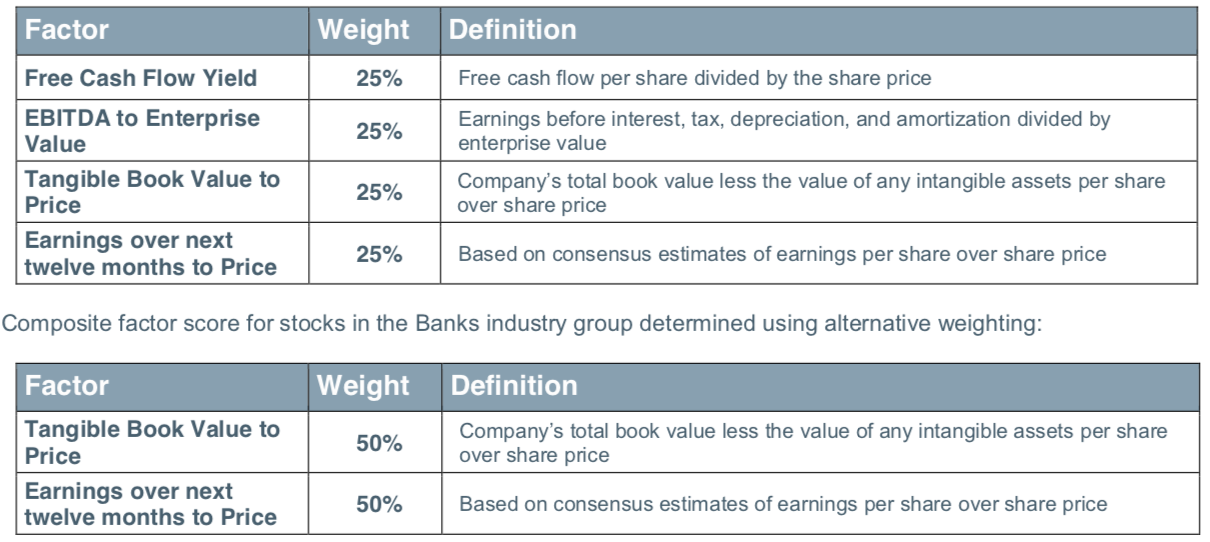 I explained my affinity for free cash flow yield above, and while it isn't directly related to whether or not a company is attractively valued, it suggests that it has a healthy balance sheet, something that is always welcome in a portfolio. The use of estimated earnings growth I also find interesting. It's essentially saying that even if a company has a high P/E, something that may be a disqualifier in other ETFs, it could still be a relative value if it's got the earnings to back it up. I like this fund.
Highly correlated ETF: Vanguard Value ETF (VTV)
Fidelity International High Dividend ETF (FIDI)
FIDI is essentially the international equivalent of FDVV.
 The only real difference is here is that FIDI starts with a universe of the largest 1000 companies within international developed markets instead of the United States, no emerging markets here. Pretty much everything I mentioned above with FDVV applies here as well.
Highly correlated ETF: iShares International Select Dividend ETF (IDV)
Fidelity International Value Factor ETF (FIVA)
Same thing here with FIVA. Its the international equivalent of FVAL.
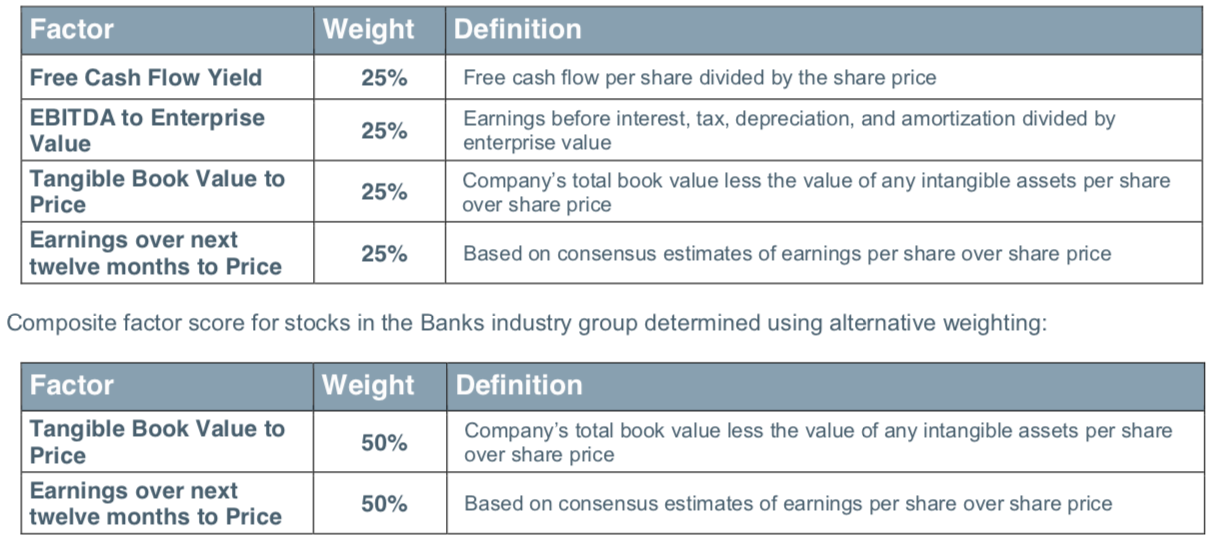 FIVA uses the same starting universe as FIDI. I like Fidelity's value methodology, but this ETF has failed to gain any real traction since its launch as far as assets under management are concerned. This ETF might be one to avoid until it builds up its asset base a bit.
Highly correlated ETF: iShares MSCI EAFE Value ETF (EFV)
Fidelity Low Duration Bond Factor ETF (FLDR)
FLDR invests in a combination of investment-grade floating rate corporate bonds and intermediate-term U.S. Treasury notes (remaining maturities between 7-10 years) in order to target an overall portfolio duration of around 0.9 years. Essentially, this fund eliminates most rising interest rate risk and just leaves the credit risk of the underlying issuers.
About 90% of the fund's assets are invested in corporate notes so this is really just a glorified floating rate bond ETF with the yield and risk characteristics that come with such a fund.
Highly correlated ETF: iShares Floating Rate Bond ETF (FLOT)
Fidelity High Yield Factor ETF (FDHY)
FDHY is technically an actively managed fund that uses an index to guide its selection process. It scours the junk bond universe to target issues with solid total return potential that exhibit both value and quality characteristics. Essentially, it's looking for the highest quality low-quality bonds!
The fund's yield of 5.4% is actually fairly solid given that it's targeting the high quality end of the spectrum and compares nicely to the 5.8% yield of the SPDR Bloomberg Barclays Short Term High Yield Bond ETF (SJNK). I don't have an issue with the way the portfolio is constructed, but (not to sound like a broken record here) the relatively high expense ratio is a net negative.
Highly correlated ETF: Deutsche Xtrackers Low Beta High Yield Bond ETF (HYDW)
Conclusion
I think Fidelity's smart beta lineup is a bit of a mixed bag. The Value, Quality and Low Volatility ETFs seem to be smartly constructed, but the Momentum and Rising Rates ETFs leave some room for improvement. In pretty much every case, there are cheaper (sometimes much cheaper) alternatives available. Being someone that rates fees and expenses as the most important factor in choosing an ETF, I'd hesitate to recommend more than one of these products. Overall, I think Fidelity is putting some thought into their smart beta lineup and looking to create some differentiation between similar products through its use of different selection criteria. I just wish they were a little cheaper!
If you enjoyed reading this article, please be sure to share it below and subscribe to the site so that you don't miss any updates or new stuff! As always, thank you for taking the time to read!
